Coordinates are in the ICRS, equinox J2000, and in decimal degrees. The only exception from this are ecliptic and galactic coordinates, when the spacecraft is required to build the zodiacal and scattered light models; these coordinates would be time-dependent if specified as RA/Dec in the ICRS.
The NISP detectors are read using the multi-accumulate (MACC) mode.
For details see Kubik et al. (2016). The photo and spectro modes are MACC(4,16,4) and MACC(15,16,11), respectively.
The NISP line time is: 710 \(\mu{\rm s}\)
The NISP frame time is then: NF = 2048*710 \(\mu{\rm s}\) = 1.454080 s
The rounded up nominal total exposure times are then:
photo-MACC: 111 s
spectro-MACC: 573 s
VIS: 573 s
The VIS and NISP-S exposure times are tied to each other.
For every 565s nominal science (NS) exposure in the Reference Observation Sequence (ROS), there is an opportunity to acquire one VIS calibration frame.
When a calibration requires a sequence of ROS_D1 acquisitions to be run, the calibration frame should default to short science (SS), but once every 6 hours or so (or 4x per day), the calibration frame should be a Bias. It is recommended to bracket the sequence ends with a Bias ROS_D1.
Some CALBLOCKs require a sequence of nominal ROS acquisitions.
Of the 4 dithers in a pointing, the first 2 dithers are accompanied by a SS acquisition. Most other VIS calibration frames, bias, dark, flats (FF), charge injection (CI), and trap pumping (TP) are also acquired within the ROS framework. [EUCL-EST-TN-1-019_v1.2: Euclid Reference Observation Sequence]
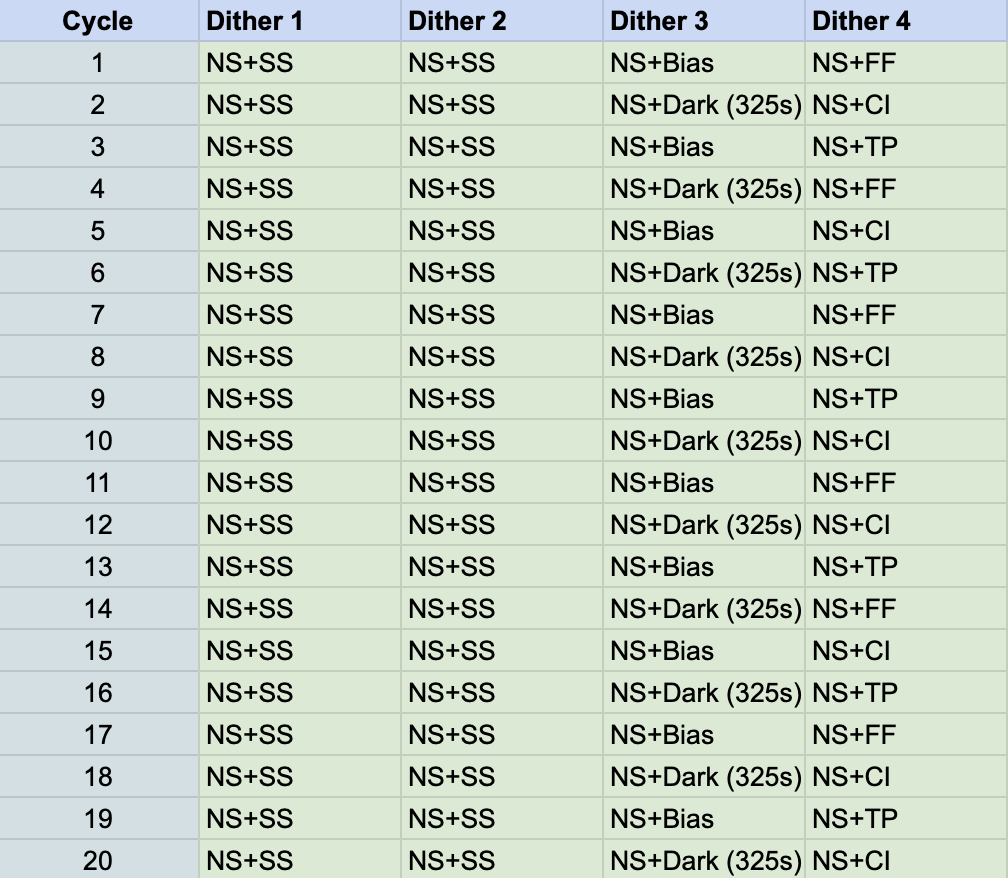
Slightly less than 20 ROS pointings (each with 4 dithers) are executed over 24 hours. The distribution of the calibration frames over 20 ROS pointings cycle as follows:
Figure 1: The MASTER VIS ROS cycle. Approximately 6 FF, 8 CI, and 6 TP frames are acquired per day; approximately 10 each of Bias and 325s Dark frames each are acquired per day.
The VIS calibration acquisition allotments are indicated in the MASTERcycletable.
Within the master cycle, the parameters for the SS and Bias frames are always identical; others (such as with Dark) have variable settings that cycles.
The auxiliary configuration and cycle tables for the individual calibrations (SHORTconfig, SHORTcycle, BIASconfig, BIAScycle, DARKconfig, DARKcycle) indicate the cycle pattern for SS, Bias and Dark calibration settings.
The TP consists of the vertical trap pumping (VTP) varieties only – serial trap pumping (STP) is not part of the ROS. There are 90 variants of VTP, which have a predetermined configuration cycle (TPcycle, VTPconfig). The complete TP set is acquired over approximately 18 days.
The FF consists of variants with different LEDs and fluences. The configuration and cycling (FLATconfig, FLATcycle) are chosen to provide data primarily for PRNU and Blooming, but also to monitor the CTI EPER on a weekly basis. (Note that PTC/gain monitoring is covered in the monthly F-007 CalBlock.) The FF cycle completes over approximately 28 days (4 weeks).
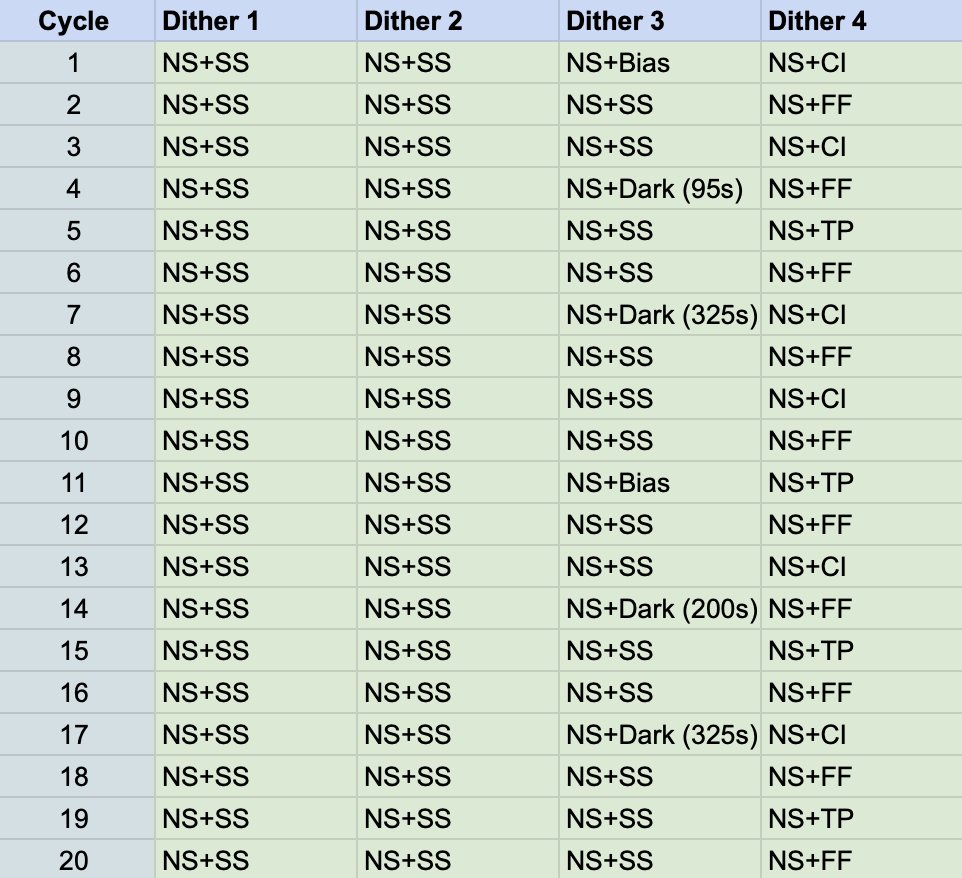
During PDC thermalization, it is recommended to adjust the VIS MASTER cycling in a way such that it is consistent with the heat output of a Nominal Science (NS) acquisition at a cadence of about 6.5 frames per hour. Since it was found in that CI and TP run slightly warmer (+0.02 and +0.03 K, respectively) than NS, SS or FF, which run warmer than Bias and Darks (+0.04K), 3 Bias/Darks should be compensated with 6 CI, or 4 TP.
Figure 2: One example of a MASTER VIS ROS cycle for PDC thermalization. Approximately 10x FF, 6x CI, and 4x TP frames are acquired per day; approximately 2x Bias and 4x Dark frames each are acquired per day.
VIS Trash Bias acquisition (Bias stabilization after long idle time)
After long periods of inactivity, VIS Biases are known to drift and show top-bottom (of the CCD) asymmetry. This Bias asymmetry is similar to that seen immediately after an ROE reset, where the effect is expected due to the initial ROE voltage settings. The asymmetry is cleared after the a single science sequence (e.g., Bias) acquisition, when the ROE voltages are set to the science acquisition settings.
To mitigate this effect (and possibly to reset the ROE voltages ready for VIS science sequences), “3x Trash Biases” are to be acquired after a VIS idle time longer than 2 hours, and immediately prior to any VIS science activity (e.g., at the end of the SOPS window or NISP-only calibration sequence).
Note that during long VIS idle time, charge can accumulate on the VIS CCD due to cosmic rays. These excess charge (which may cause persistence issues) will also be cleared out with the Trash Bias acquisition.
Data volumes are for compressed data, with the exception of NPR and NSR, where the data are relatively noisy and compression is ineffective. For NISP see EUCL-IBO-TN-7-041.
Data volume has an upper limit of 4278MB (=0xFF000000 bytes) per pointing, which is an MMU limit for a single file.
A single pointing is expected to generate a single MMU file per unit (VIS and/or NISP DPU1 and DPU2).
NISP photo-MACC: NP = 59 MB (science mode)
NISP photo-MACC: NPR = 537 MB (16 bit * 2048*2048 pixel * 16 detectors * 4 groups; eng. raw mode)
NISP spectro-MACC: NS = 163 MB (science mode)
NISP spectro-MACC: NSR = 2013 MB (16 bit * 2048*2048 pixel * 16 detectors * 15 groups; eng. raw mode)
VIS: VS = 452 MB for nominal and short science
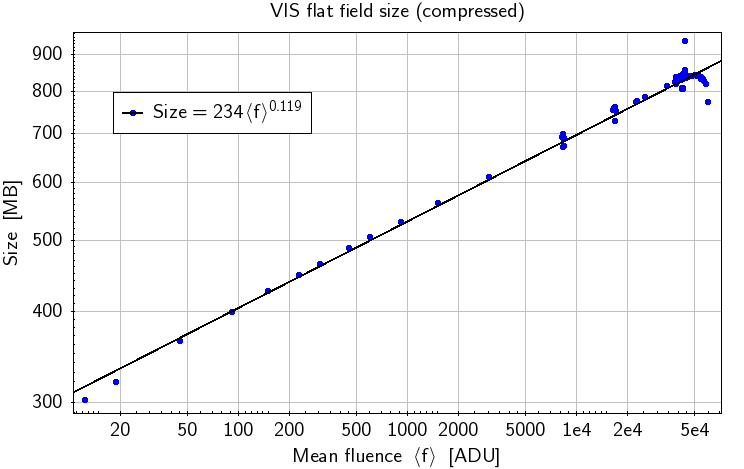
VIS: VF=234*fluence^0.119, binned into:
Figure 3: File size of compressed VIS flats against mean fluence (CSL TVac, 2021)
VF = 835MB when compressed with reordering, the maximum filesize at ~40k ADU
VIS: full-frame charge injection (CI) images have filesizes similar to the equivalent flat fields (VF), that is dependent on the charge injection level. Since the trap pumping (TP) images are based on CI images, the filesize estimates are similar as well.
VIS: VD = 323 MB for 350s darks
VIS: VB = 250 MB for biases, due to very low number of cosmics
ROS: ROS = 4981 MB (including 2 VIS short science, VIS flat field, and NISP slew dark)
ROS_D1: ROSD1 = 1303 MB (including VIS short science, and NISP slew dark)
Euclid has 4 physically different grisms, 3 red grisms (RGS000, RGS180, RGS270) and one blue grism (BGS000). The numbers indicate the angle of dispersion in the detector plane. The blue grism is used for legacy science.
Due to the non-conformity of the RGS270, it is not planned to be used in the survey. The necessary angles to decontaminate the spectra are obtained by using the RGS000 and RGS180 with their nominal 0 degree orientations as well as 4 degree offsets applied to the grism wheel mechanism. The CalF refers to the rotated positions as RGS000_rot and RGS180_rot when applicable, and treats them as physically different grisms. This is because the dispersion solution, vignetting, wavelength zeropoint etc are different and cannot be inferred in a simple and straight-forward manner from the calibrations taken at zero degrees. In the ROS the so-called K-sequence will be used, i.e. RGS000, RGS180 +4 deg, RGS000 -4 deg, RGS180.
Nonetheless, the RGS270 serves as an important fall-back solution in case the K-sequence does not work as expected at an operational level, or in case there is a problem with one of the grisms. Therefore, calibration observations for the RGS270 will be obtained during the PV phase as for all other grisms.
Thus, in total there are therefore 6 effective grisms to be calibrated: The RGS000, RGS000_rot, RGS180, RGS180_rot, RGS270, and the BGS000.
VIS Calibration Unit (VI-CU) has 12 physical LEDs: 6 different monochromatic wavelengths, each belonging to the Nominal and Redundant hardware. Since each (nominal and redundant) LED are located at a slightly different position, their illumination coverage onto the VIS FPA also differ slightly. Due to similarity of wavelengths in two pairs of LEDs, only 4 LED types are used for nominal calibration (LED1 to LED4).
(EUCL-IAS-RP-6-001 VIS CU design report, v4.2, 2018-10-29)
The fluence onto the FPA depends on (1) LED_DELAY (the duration which the LED is on), and (2) LED_CURRENT (in mA). Below are the calibration curves based on measurements from EUCL-IAS-TR-6-022, v1.0 (VIS CU FM Last optical performances tests report), scaled to the CSL measurements. The fluence is based on LED_DELAY=1000ms; lower fluences can be specified by choosing smaller LED_DELAY values.
The assumption is that LED_DELAY and the fluence (as calculated from LED_CURR) have a linear relationship, which is verified to within a few percent by ground data acquisitions down to 3mA and 1ms for the Nominal LED3.
Table 2: VI-CU Calibration normalized to LED_DELAY=1000ms (pre-launch).CSVfile
# LED
fluence@146K (ADU/s)
verified (tested) range [mA]
allowed LED_CURR range [mA]
LED1 Nominal (590)
3570 * (I[mA]-2.33)
3.62<I<15.8
0<I<40
LED2 Nominal (644)
2680 * (I[mA]-3.19)
4.94<I<20.7
0<I<24
LED3 Nominal (720)
5340 * (I[mA]-1.73)
2.65<I<11.1
0<I<40
LED4 Nominal (885)
6800 * (I[mA]-1.65)
2.38<I<9.07
0<I<40
LED5 Nominal (880)
5760 * (I[mA]-1.66)
2.52<I<10.6
0<I<40
LED6 Nominal (610)
3880 * (I[mA]-2.13)
3.39<I<14.9
0<I<40
LED1 Redundant (590)
3270 * (I[mA]-2.42)
3.81<I<16.9
0<I<40
LED2 Redundant (644)
2660 * (I[mA]-3.21)
4.95<I<20.7
0<I<24
LED3 Redundant (720)
5440 * (I[mA]-1.75)
2.65<I<10.9
0<I<40
LED4 Redundant (885)
6670 * (I[mA]-1.65)
2.39<I<9.17
0<I<40
LED5 Redundant (880)
5860 * (I[mA]-1.66)
2.52<I<10.5
0<I<40
LED6 Redundant (610)
3790 * (I[mA]-2.15)
3.44<I<15.2
0<I<40
The ground-based (pre-flight) CSL raw data are listed in the table below.
Table 3: VI-CU fluence (ground measurements at CSL).CSVfile