CALBLOCK-PV-029: VIS Photon Transfer Curve and CTI/EPER
Observation configuration file
Scheduling
Execute 2 times during PV phase, with 4 weeks in between.
In case of failure of the first run, repeat within two weeks, maintaining at least two weeks to the 2nd run. In case of failure of the 2nd run, repeat at the next possible opportunity.
Time-critical
No
Dependencies
VS-CU commissioned
Objective
Obtain the photon transfer curve (PTC) and the CTI/EPER for every detector quadrant. The PTC curve yields the gain.
The PTC curve is affected by the non-linearity (NL) of the electronics (Note: this is independent of the differential nonlinearity discussed below). Hence the PTC analysis can yield NL estimates (CALPRODUCT-VS-016), which can be used as comparison to the primary means of estimation using CALBLOCK-PV-024 (On-sky NL) and PV-033 (Flat NL).
Differential nonlinearity (DNL): In the VIS electronics, the conversion of the read out analog voltage to the binary value happens to depend on the bits which are set in the binary representation of that value. This means that the gain of the entire detector chain including the ADC is effectively different from one bit to the next. We account for DNL in the PTC calibration observations by running two different sets of fluences that are shifted with respect to each other.
Beyond the bias level, and at every conceivable flux level in the science images, DNL should not be a problem for mean values or source photometry. However, DNL does affect noise and variance, and possibly covariance. Also, it appears that not only the first bit is affected (even-odd), it seems as if every bit shows the effect to some degree, some CCDs (or perhaps ROEs) more than others. The effect on shape measurements must be evaluated by simulations. There likely is also an effect on low-surface-brightness studies.
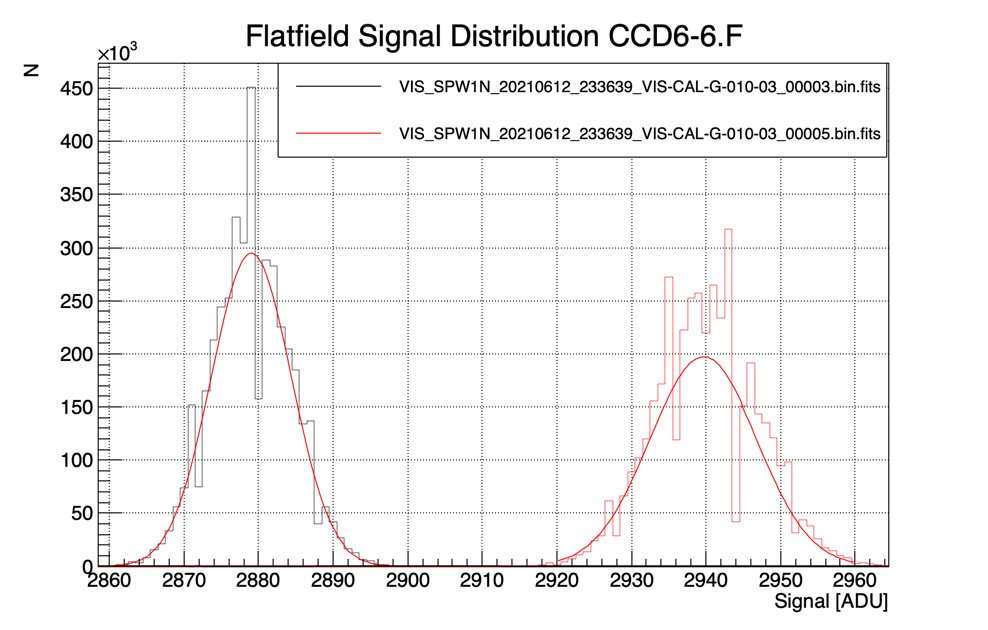
Figure 18: Distribution of pixel values for two different LED fluxes. The distributions are approximately Gaussian, as shown by the best-fit curves.
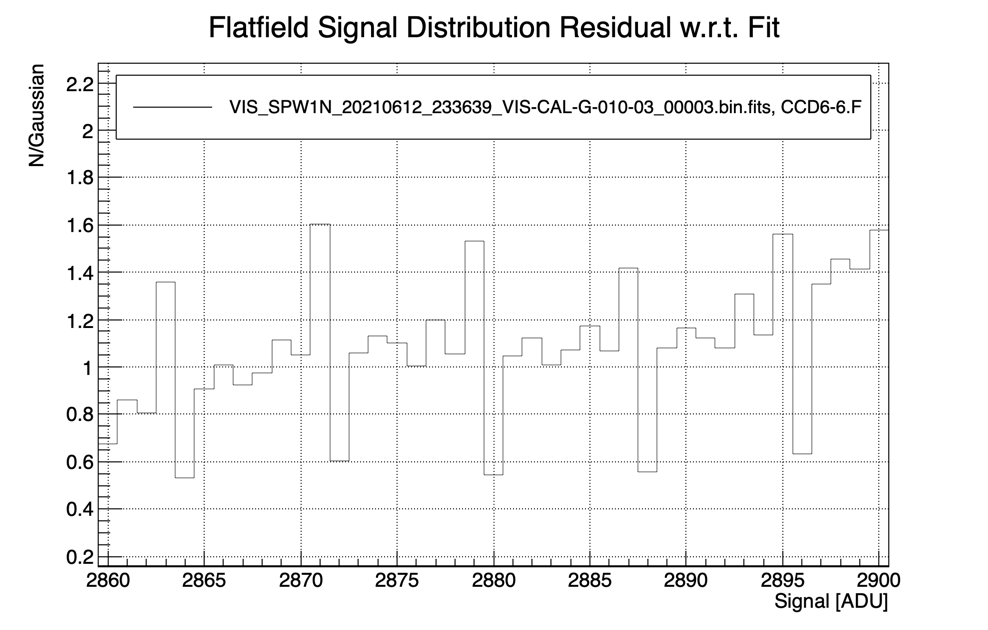
Figure 19: Zoom in on the first peak, normalized by the best-fit Gaussian. The DNL manifests itself in some pixel values being underrepresented, while neighboring values are overrepresented. There is a strong asymmetry with respect to bit 3, and some indication of an odd-even effect.
Observations
CTI-EPER: Two flat fields each with LED3, at fluences 300, 500, 1000, 2500, 6000, 18000 ADU.
PTC: Pairwise flat fields. The exposures must form a contiguous series. Two series must be observed after each other, with the following (approximate) fluence settings (ADU):
Series 1: 12.5, 25, 50, 100, 200, 400, 800, 1000, 16000, 2500, 3200, 6400, 128000, 25600, 51200, 60000
Series 2: 8, 16, 32, 64, 128, 256, 512, 1024, 2048, 4096, 8192, 17384, 32768, 51200, 60000
Science exposures are required for each dither position to enable object masking.
To neutralize AOCS wait times, and to accommodate antenna repointing, the following strategy provides flat frames for both PTC and CTI/EPER calibrations. Taking the flat fields pairwise is mandatory for PTC, and optional for CTI/EPER. Flat-field pairs cannot be accommodated in the ROS, and must therefore be taken separately. Biases are interspersed to help determine the bias level for CTI/EPER.
The calibrations are independent of wavelength, and use LED3 with a current of 3 mA. At this current, the LED intensity corresponds to 6500 ADU/s:
LED3 signal [ADU/pixel/s] = -9557 + 5353 * I [mA] for I>= 3 mA
Two series of flats are to be executed without interruption. The 1st series steps through fluences 3*2^i, with i=2...14, with some additional values inserted for the CTI/EPER calibration. The 2nd series steps through fluences 2^i, with i=3...15, with the same additional CTI/EPER fluences. The fluences are pseudo-random shuffled to counter the effects of any slow drifts; it is important to keep that order in the observations.
BIAS, 2 flats each at fluences: 1600, 12, SS, dither
BIAS, 2 flats each at fluences: 25600, 800, SS, dither
BIAS, 2 flats each at fluences: 3200, 18000, SS, dither
BIAS, 2 flats each at fluences: 2500, 500, SS, dither
BIAS, 2 flats each at fluences: 6000, 50, SS, dither
BIAS, 2 flats each at fluences: 400, 40000, SS, dither
BIAS, 2 flats each at fluences: 300, 25, SS, dither
BIAS, 2 flats each at fluences: 12800, 1000, SS, dither
BIAS, 2 flats each at fluences: 100, 6400, SS, dither
BIAS, 2 flats each at fluences: 200, 51200, SS, dither
BIAS, 2 flats each at fluences: 60000, SS, dither
BIAS, 2 flats each at fluences: 1600, 8, SS, dither
BIAS, 2 flats each at fluences: 25600, 800, SS, dither
BIAS, 2 flats each at fluences: 4096, 16384, SS, dither
BIAS, 2 flats each at fluences: 2048, 512, SS, dither
BIAS, 2 flats each at fluences: 6000, 32, SS, dither
BIAS, 2 flats each at fluences: 400, 32768, SS, dither
BIAS, 2 flats each at fluences: 256, 16, SS, dither
BIAS, 2 flats each at fluences: 12800, 1024, SS, dither
BIAS, 2 flats each at fluences: 64, 8192, SS, dither
BIAS, 2 flats each at fluences: 128, 51200, SS, dither
BIAS, 2 flats each at fluences: 60000, SS, dither
Fulfilling
CALPRODUCT-VS-018: VIS Extended Pixel Edge Response (CTI-EPER)
CALPRODUCT-VS-011: VIS Photon Transfer Curve (PTC)
CALPRODUCT-VS-014: VIS LED Pixel Response Non-uniformity (PRNU) (also)
CALPRODUCT-VS-004: VIS Brighter-fatter Effect (BFE) (also)
CALPRODUCT-VS-016: VIS Nonlinearity (as a cross-check)
CALPRODUCT-VS-020: VIS Blooming threshold (partially; adding 51.2 kAFDU and 60 kADU fluences)
Targets and pointing constraints
Pointing: Straylight suppression as per MOCDA-SYS-003.
# ID |
R.A. |
Dec |
SELFCAL-FAINT |
268.51 |
65.09 |
Instrument configuration
Instrument: VS-CU LED3 on
Methodology / Uplink procedure
Entity: VIS
Commanding Method: VIS:
Dither Sequence: Random dither offsets in a 3’ box
Inter-operability constraints
None.
In-orbit duration
- In-orbit Duration: 12.4 h + dither (x22) [single block duration]
A block must be repeated once later in the PV phase, for a total of two blocks.
A single block consists of two parts:
6.2 h + dither (x11) [PTC-Series1]
6.2 h + dither (x11) [PTC-Series2]
A single dither sequence consists of 1 bias, 4 flat fields, one SS, and a dither. A single flat lasts: 10 s for RSU operation and the actual exposure, and 72 s for readout and various lengths (depending on the fluence level) for CDPU processing.
Note that 66s of the CDPU processing time has been absorbed into the dither/slew duration.
Data volume
Total = 67644 MB
22*VB + 22*VS = 15444 MB
16*VF = 6400 MB (VF= 400 MB)
16*VF = 8000 MB (VF= 500 MB)
16*VF = 9600 MB (VF= 600 MB)
12*VF = 8400 MB (VF= 700 MB)
12*VF = 9600 MB (VF= 800 MB)
12*VF = 10200 MB (VF= 850 MB)
Processing input
Ground Processing Input Data: BPM, nonlinearity calibration correction, ground-based QE
Data Description: Total of 22 Biases, 22 SS, 84 flats
Processing output
PTC curves, gain and CTI EPER for each detector.
Required accuracy, constraints
Expected flux levels within TBD%
Processing tools
L1 small scale flat pipeline, trending statistics
Quality control parameters
DataModel: https://gitlab.euclid-sgs.uk/
Contact person
VIS instrument scientist